
Liverpool 2 – 0 Brentford
 The Bees had the first xG generating shot of the game on 12’ through KLP, although his shot was blocked.… and just a minute later, Brentford conceded from their own corner.
Just a quick burst of pace from Jota and Diaz left them 2 on 2 and resulted in Diaz firing past Flekken.
Being brave was a punishment in this case but is encouraging that we are committing men forward against this type of opposition, as opposed to sitting back and letting the opposition take charge.
This is particularly so, given our horrid fixture list in the coming weeks, we need to make and take chances where possible to get some points on the board.
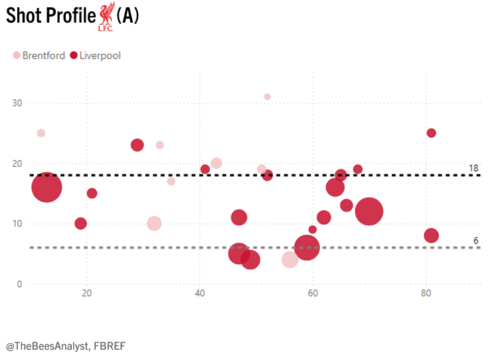
Liverpool had 19 shots, 8 on target, with an average xG of 0.14 per shot, compared to just 0.05xG per shot for Brentford (8 shots, 2 on target).
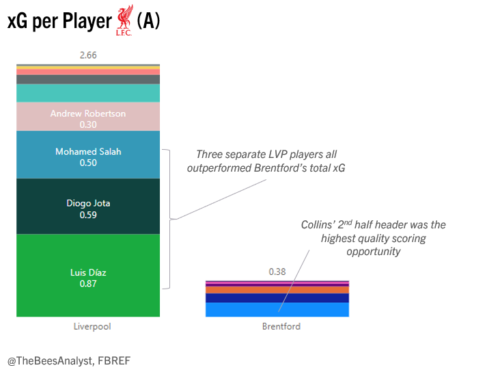
Diaz, Jota and Salah individually all managed to accumulate more xG than Brentford.
Liverpool’s defence was near water-tight
Truth be told, after the 1st half, Brentford never looked like scoring, only managing to create low-quality chances. We saw Liverpool come out stronger in the second half against Ipswich last week, and perhaps a trend is emerging of Slot formulating his team to become stronger after the break.
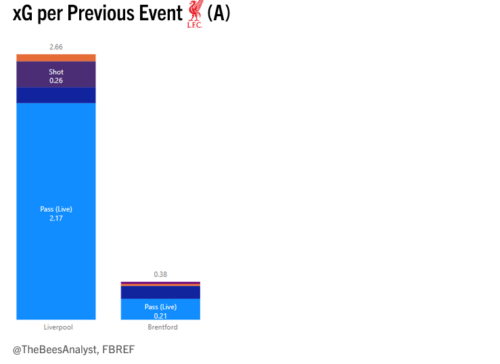
Liverpool’s live ball quality is shown through this graph, where 2.17 xG was created through a live pass.
However, Liverpool did not create any xG from take-ons, showing that the Bees defence performed well to keep Diaz (top 22% of take-ons) and Co., quiet for large parts of the game.
Ajer had a fantastic game!
He excelled in his defending against Salah, which put up a fascinating watch. Unfortunately, he was caught too far up the pitch when we lost possession in midfield for their second goal, where a huge gap emerged on the left side of our penalty area before Diaz picked out Salah on that left hand side for him to fire home and double Liverpool’s lead.
Just looking at the shots
Brentford’s highest xG shot (and closest to goal) was through a Collins header on 56’ but was right at Alisson.
The previous ball from Jensen was pinpoint perfect, and that header a yard either side of Alisson would have put us on level terms.
Coming up against a team like Liverpool, you have to expect them to create the better chances in the game, but the combined efforts of Collins, Ajer and Flekken really made a difference and prevented it from being a riot from Liverpool.
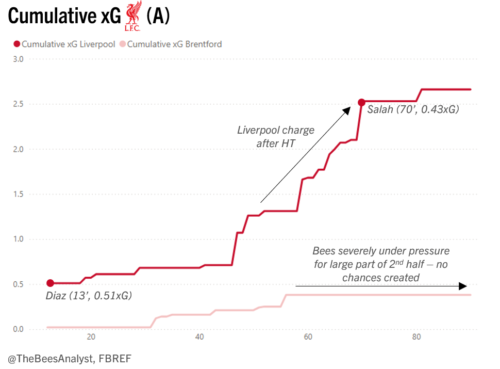
Comparing xG as the game went on
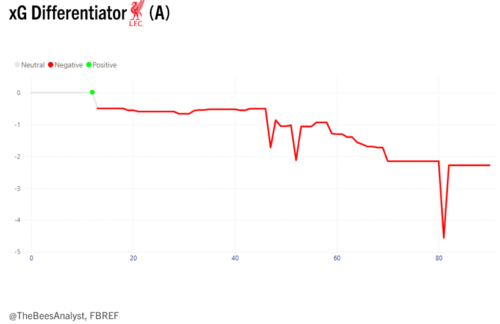
xG Differentiation is to showcase where in the game, the cumulative xG of one team outperforms the other. In this graph, green shows where Brentford’s total xG at that given minute in the game outperformed Liverpool’s total xG, and vice-versa.
We were only ahead on xG for 1 minute during the game, after KLP’s first shot.
After the Diaz goal, we managed to keep Liverpool relatively quiet in the 1st half, limiting them to just 5 shots.
However, after half time, the red line immediately drops significantly, showing the onslaught of attack Liverpool brought after the break.
And then came Southampton…
A much different game; home advantage, attacking lineup and formation, weaker opposition (with all respect to Southampton)… and the data shows just how different it was…
Bees 3 (2.82 xG) – Saints 1 (1.57 xG)
This is my favourite visualisation.
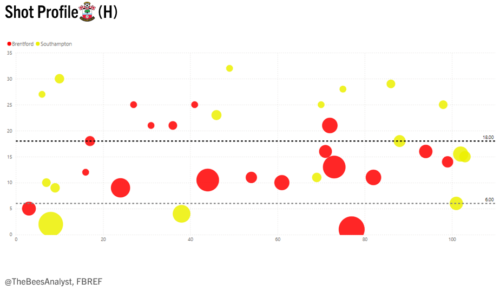 The graph shows that Brentford had a decent mix of shooting outside the box and working their way inside the box.
The average shot distance to goal was 14.6 yds for Brentford, and 18.1 yds for Southampton, showing our ability to get inside that penalty area, and keep Southampton out – significantly different to Liverpool, where only 3 of our shots were taken inside 18 yds.
Brentford played eye-catching football throughout and although we had lower possession, we made the most of it. Mbeumo and Wissa created 1.90 xG between them, showing just how important they were in this game and how pivotal it is they keep fit and playing throughout the season.
Southampton did have some high-quality chances, particularly Aribo’s shot which came off the woodwork in the 7th minute, and registered the 2nd highest xG chance of the game (behind Wissa’s 69th minute goal).
Ultimately, a lack of clinical finishing was missing from Southampton. Their lack of finishing ability showed a real weakness (particularly Armstrong’s miskick with an open goal in front of him). But it also felt like Brentford overthought and overplayed the ball in dangerous areas where a shot would have been more effective. I understand us trying to get into positions where the highest chance to score is, but sometimes the best thing to do is just shoot.
Wissa and Mbeumo again came up with the goals, and looked threatening all game. But my MOTM goes to Mikkel Damsgaard, it felt like he was going to create something every time he was on the ball. His pressing was nothing short of incredible, particularly given his physique, and that high intensity pressing was rewarded with two goals.
It’s really interesting to compare the Southampton and Liverpool bubble charts to see the differences in where Brentford and the opposition made chances. I actively encourage you to look at the graphs to get a feel for how the game flowed and make your own conclusions about the performance based on the data!
Tom Hayward
Tom is an analyst with Armstrong